
CHARTING THE COURSE

“Give me six hours to chop down a tree and I will spend the first four sharpening the axe.”
You may remember my first blog, Step One: FORM (Nov. 11, 2022), in which I explained how I used the irrational number, phi (1.618033988749... or φ), to proportion the sections of my new clarinet sonata. The result was a series of charts that determined the exact point at which each new segment of the form would begin. The whole thing is nested together like a Matryoshka doll (Russian tea doll).

In a piece in which form is the primary focus, it probably comes as no surprise that each formal division (the point at which a new part of the form begins) is marked by a change in energy—often a musical event such as a new theme or sudden shift in meter. But not every phi point is equal. For instance, in the plan that I laid out above, the phi point that marks the transition from the second movement to the third is much more significant than the phi point that marks the central c theme of the third movement. The former is the first layer of phi divisions while the latter is four layers deep.

The next step is determining the phi point hierarchy, which will prioritize each phi point from large to small and therefore the most important divisions to the lower-level events. I needed a graph of the phi points which depicted the relative importance of each event over time. I could have shown the data points in the form of a simple bar graph as in the example below, but I chose to connect the datapoints as a continuous line. You’ll see why in the next step.

ENERGY
It’s clear from the chart that structural changes occur at each phi point but what I wanted was a guide to what happens with the energy.
Musical energy is hard to quantify (that’s the next blog) but it normally comes in the form of a change in one of the three main components of music: pitch, rhythm, and intensity. I have told my conducting students for years that when giving instructions, the only thing musicians really want to know is higher/lower, faster/slower, or louder/softer. When it comes down to writing these things into a piece of music, a composer has much more at their disposal. Range (highest to lowest note in a chord), number of separate pitches in a chord, quick notes, quickly changing chords, loud dynamics, or a lot of people playing quietly all create different levels of engagement for the listener—different energy levels.
How would you rate the energy level at the end of Mahler’s 9th Symphony?
Mahler - Symphony No 9 in D minor - Barenboim go to 1:11:57
Compare that to the energy level at the end of Mahler’s 2nd Symphony.
Mahler: Symphony No. 2 / Rattle · Berliner Philharmoniker go to 1:39
Think about how the different components of music add or subtract from these different energy levels. But don’t be fooled into thinking that quiet makes for low energy. Listen to how the context of silence sometimes adds up to more energy in this example from Sibelius’ cranky 5th Symphony finale.
Sibelius - Symphony No. 5 - III. Finale go to 9:18
Listen how Tchaikovsky drains energy away at the end of his 4th Symphony Scherzo to surprise us with the opening of the Finale. I once saw a napping audience member literally have a rude awakening.
Tschaikowsky: 4. Sinfonie ∙ hr-Sinfonieorchester ∙ Carlos Miguel Prieto go to 36:22
CHARTING THE ENERGY
The next step was clear. Chart the energy flow in relationship to the phi points. In other words, plan the rising and falling energy and how it delineates the form.
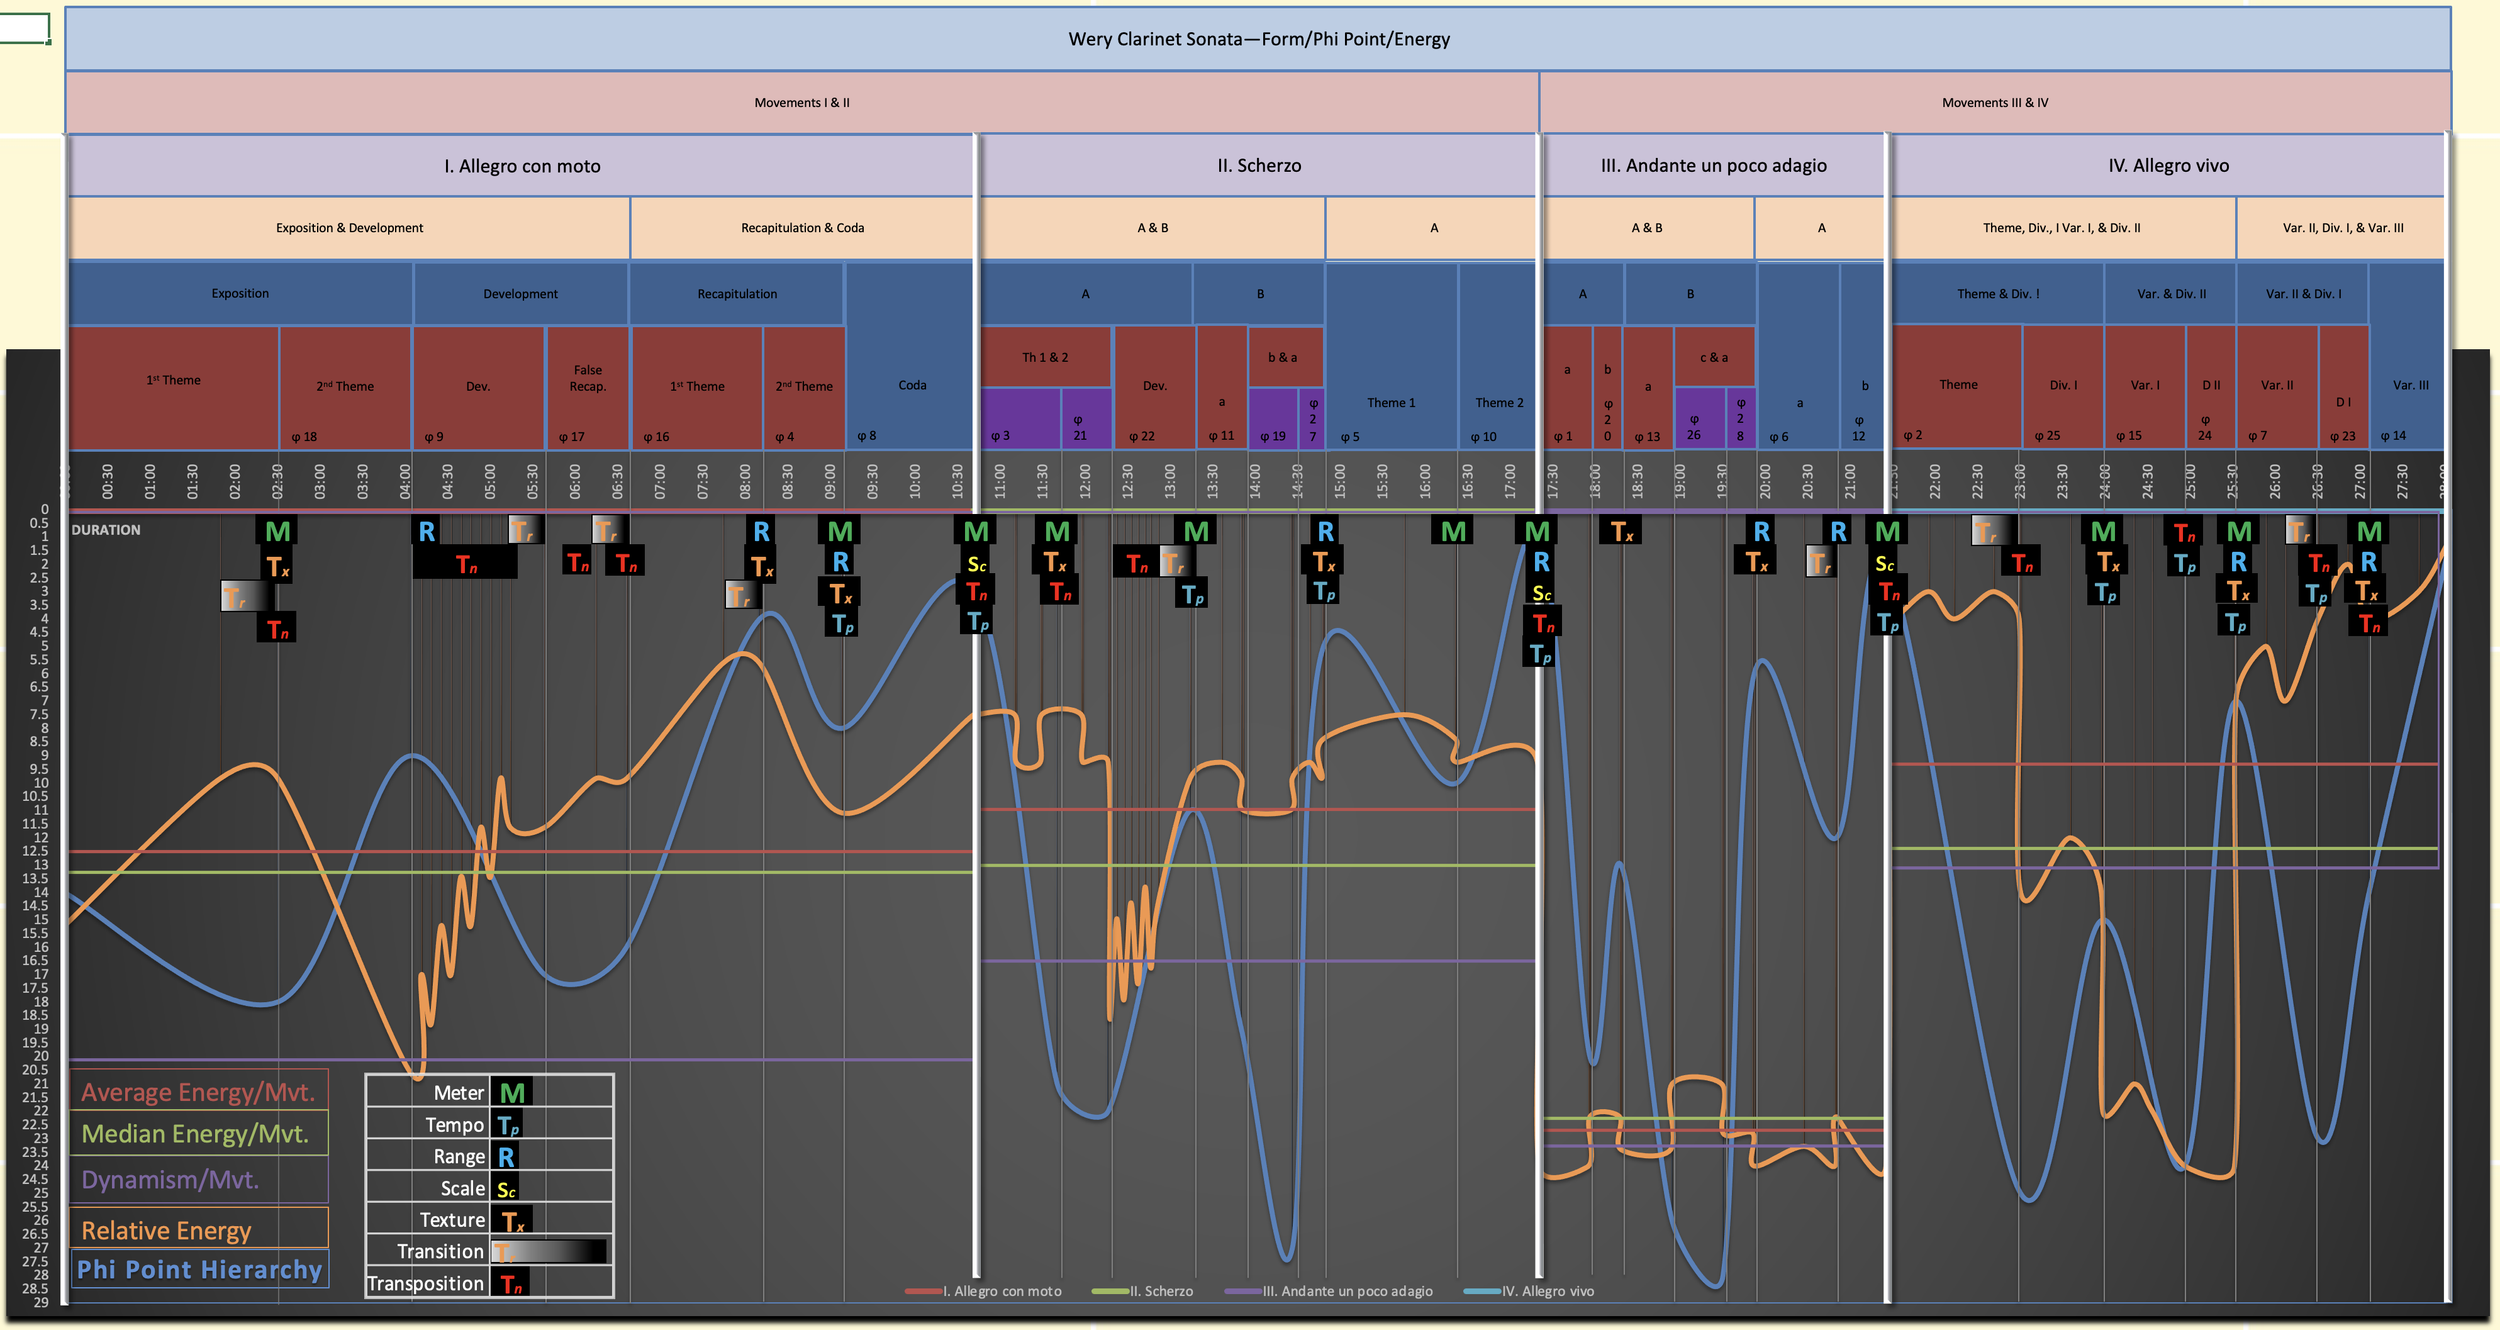
The graph of the phi points depicting relative importance over time needed to be represented as a continuous rise and fall superimposed over a linear map of the form. Like this.

Next, I needed a set of data points representing the inherent value of energy at each point throughout the piece. The values should be on a scale of one to one hundred. (Ignore the scale on the left side of the chart that appears to be a twenty-nine-point scale. I clearly wasn’t thinking ahead on this point. In order to get to a hundred-point scale, I had to write a couple of formulas that converted all of my data points. What a pain.) The points would not only correspond to the piece’s energy at each phi point but to any other changes in energy dictated by the predetermined form (see Step One: FORM, Nov. 11, 2022). Each data point would be connected to show the rise and fall of energy throughout. This line would be superimposed over the phi point hierarchy and, of course, the form. Notice that a rise in the phi point hierarchy line doesn’t necessarily correspond to a rise in the energy line. Sometimes the lines mirror each other.

This, at first, seemed like enough to get the job done. I would select relative energy levels and place them at just the right time to make the intertwining graphs. All the events would happen at the right time . . . chronologically. But if I was going to be so nerdy and picky as to employ an irrational number loved by Euclid—yeah, the math guy—to arrive at my form, it seemed clumsy to arbitrarily decide on how high or low the energy would be at each point. I knew the shape I wanted but I needed a more objective way of fine tuning the amplitude or size of each wave. I also need a way of comparing the overall energy of each of the four movements.
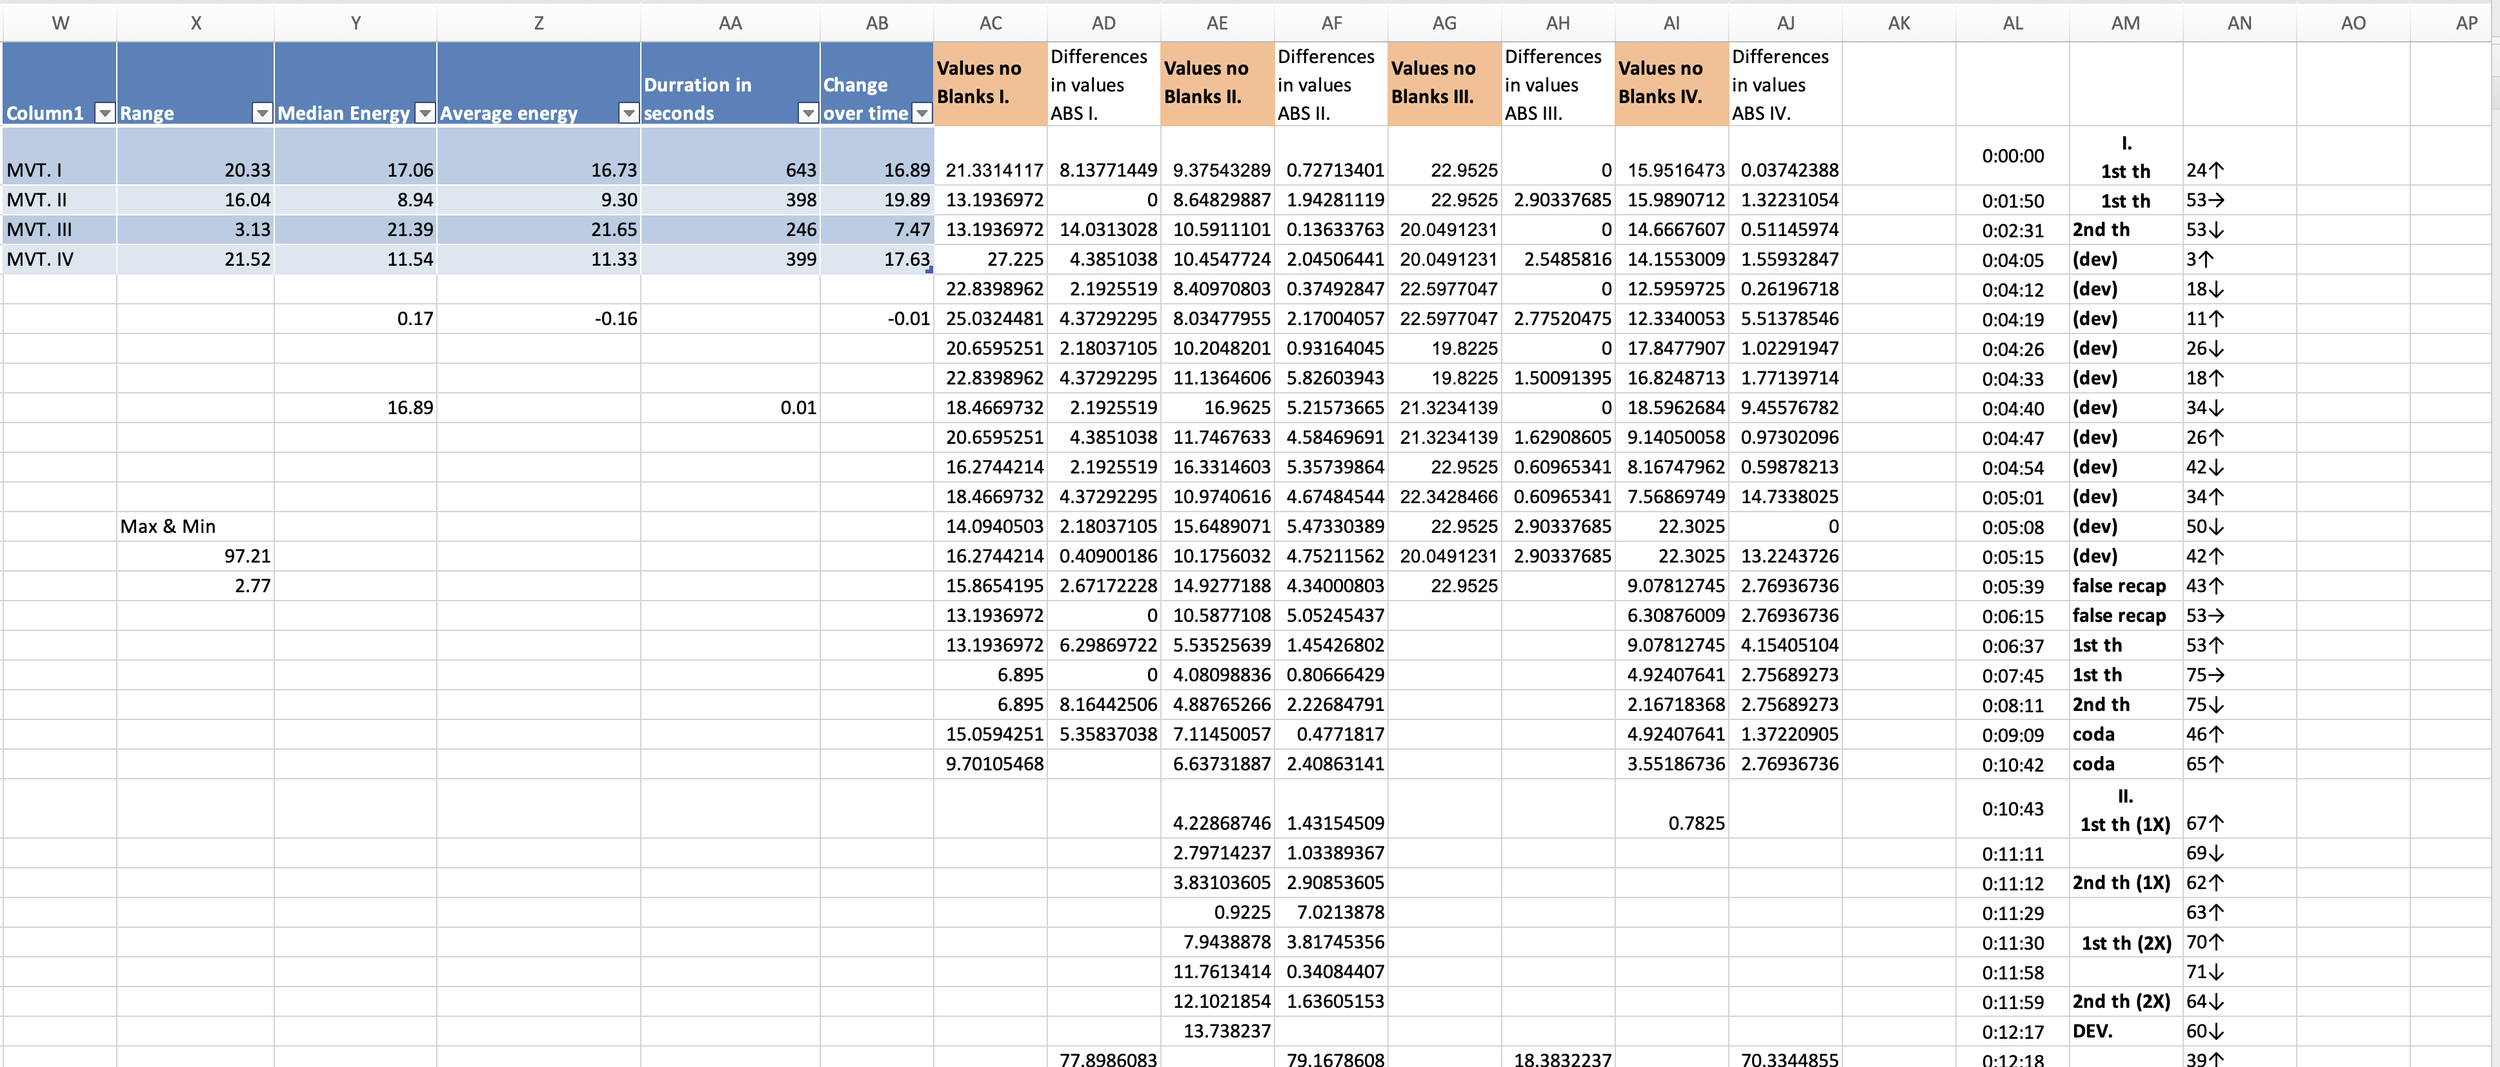
I discovered I needed to know three values: the average energy for each movement (the sum of the values divided by the number of values), the mean energy for each movement (the exact middle of the list of values), and the dynamism of each movement (the average value of change regardless of relationship to a central point). Dynamism might also be thought of as energy change over time.

As you can see, the average, mean, and dynamism seemed to be worlds apart. This did not represent a carefully planned piece of music. The next step was clear, fine tune the energy values until the average, mean, and dynamism met in the middle. I devised an Excel program that would take a whole wave or a portion of the wave and raise, lower, compress, or expand it.


As you can see, the results took a while to dial in. After a lot of trial and error—mostly error,


I was able to arrive at the completed wave.

Of course, I needed to make some preliminary decisions about how to achieve each change in energy. Note the icons representing tools of change: meter, tempo, range, scale, texture, transition, and transposition. These wouldn’t be the only things that would aid my manipulation of the energy but, at this point, I know these would be necessary for the transformations I had in mind.
Now all I had to do was find a reliable way to measure the energy of any measure of music. That shouldn’t be too hard, right? That’s the next blog.
I hope you have enjoyed reading about my efforts to write a perfectly balanced piece of music. I’ll be able to know at any point in the composition process if I need to be adding energy or bleeding energy. Please come back often to read about the progression of the sonata and please consider contributing to the commissioning project.
—BLW—