
Monsters, Bugs, and the Shape of Loud
Hello Friends,
It’s been a while since my last update. The last two months have been some of the busiest in my career. I’ve performed on nine different instruments and conducted several concerts including the premiere of my sci-fi mini-opera, The Pedesterra Cycle (an opera about sentient millipedes and centipedes). Unfortunately, these performances and their preparation have taken me away from the clarinet sonata for quite some time. I’m back at it now and thought you all deserved an update.

Just some of my activities in the last three months.
Way back in the summer, before I had to put the clarinet sonata on the back burner to write a film score for the 1920 silent film, The Cabinet of Dr. Caligari and The Pedesterra Cycle, I had crafted a detailed plan for the clarinet sonata involving the irrational number, Phi (φ or 1.618033…) used to proportion the form of the piece. The plan included specific energy levels that needed to be reached to delineate formal divisions. You may remember this chart from an earlier blog that overlays the duration, form, Phi points, and energy levels.

Phi point chart inluding energy levels (orange line).
Notice how the orange line (energy) responds to the blue line (phi points) sometimes following it and sometimes reacting in an inverse relationship. It occurred to me that if I was going to be so intentional about the rise and fall of energy, I had to be more precise about how much energy. I couldn’t go on hunches or feelings. I had to measure it. So, in May I created an energy calculator.
As I talk about the energy calculator with my wife and friends—all just a little tired of hearing about it—, I realize that not everyone thinks in terms of adding or removing energy in music. In short, high notes, fast notes, and loud notes add energy while long, low, slow notes bleed energy. Of course, that’s an oversimplification. Any one measure has at least thirty attributes that can be examined to arrive at a single energy level. You can see the data points required for the first iteration of the calculator below.

Energy Calculator 1.0
It seemed to work well enough with the exception of a few bugs. Well, the bugs became an infestation. After writing the first theme group and the recapitulation of the second theme (yes, yes I actually have started writing the sonata), it became clear that there were some serious problems with the calculator. In general, it was forcing the energy of the piece too high and after many attempts to adjust the built in calibration, it simply didn’t work accurately under certain conditions. I made the decision to rebuild the calculator. That’s what I’ve been up to. I’m happy to announce that the Energy Calculator 2.0 is up and running and working beautifully.

Energy Calculator 2.0
The new calculator has added fields and a more streamlined approach to measuring and merging data to produce the final measurement. In developing the new energy calculator, I was unhappy with the way dynamics were being measured. I realized that, perhaps, we don’t perceive, and certainly don’t perform, dynamics as a linear increase by single increments.
Dynamic change using a single increment.
I decided to replace the incremental model with a cubic curve. A cubic curve is an algebraic curve of curve order 3. The equal increments shown above are replaced by an equation that multiplies the original increment by whole integers (1, 2, 3, etc.) the result is then cubed—a cubed number is multiplied by itself and then itself again—the resulting value is then used as a percentage increase in the difference of the highest value divided by eight (the number of dynamic levels between ppp and fff ). Calibration is achieved by altering the range.

x equals the upper limit of dynamic, y the lower limit and I increasing whole integers between 1 and 8 inclusive. My apologies to any mathematicians or scientists reading this. I’m sure there is a better way to notate the equation but not bad for a dyslexic composer with a conservatory education. When the resulting eight values are plotted, they form a cubic curve. Like the one below.

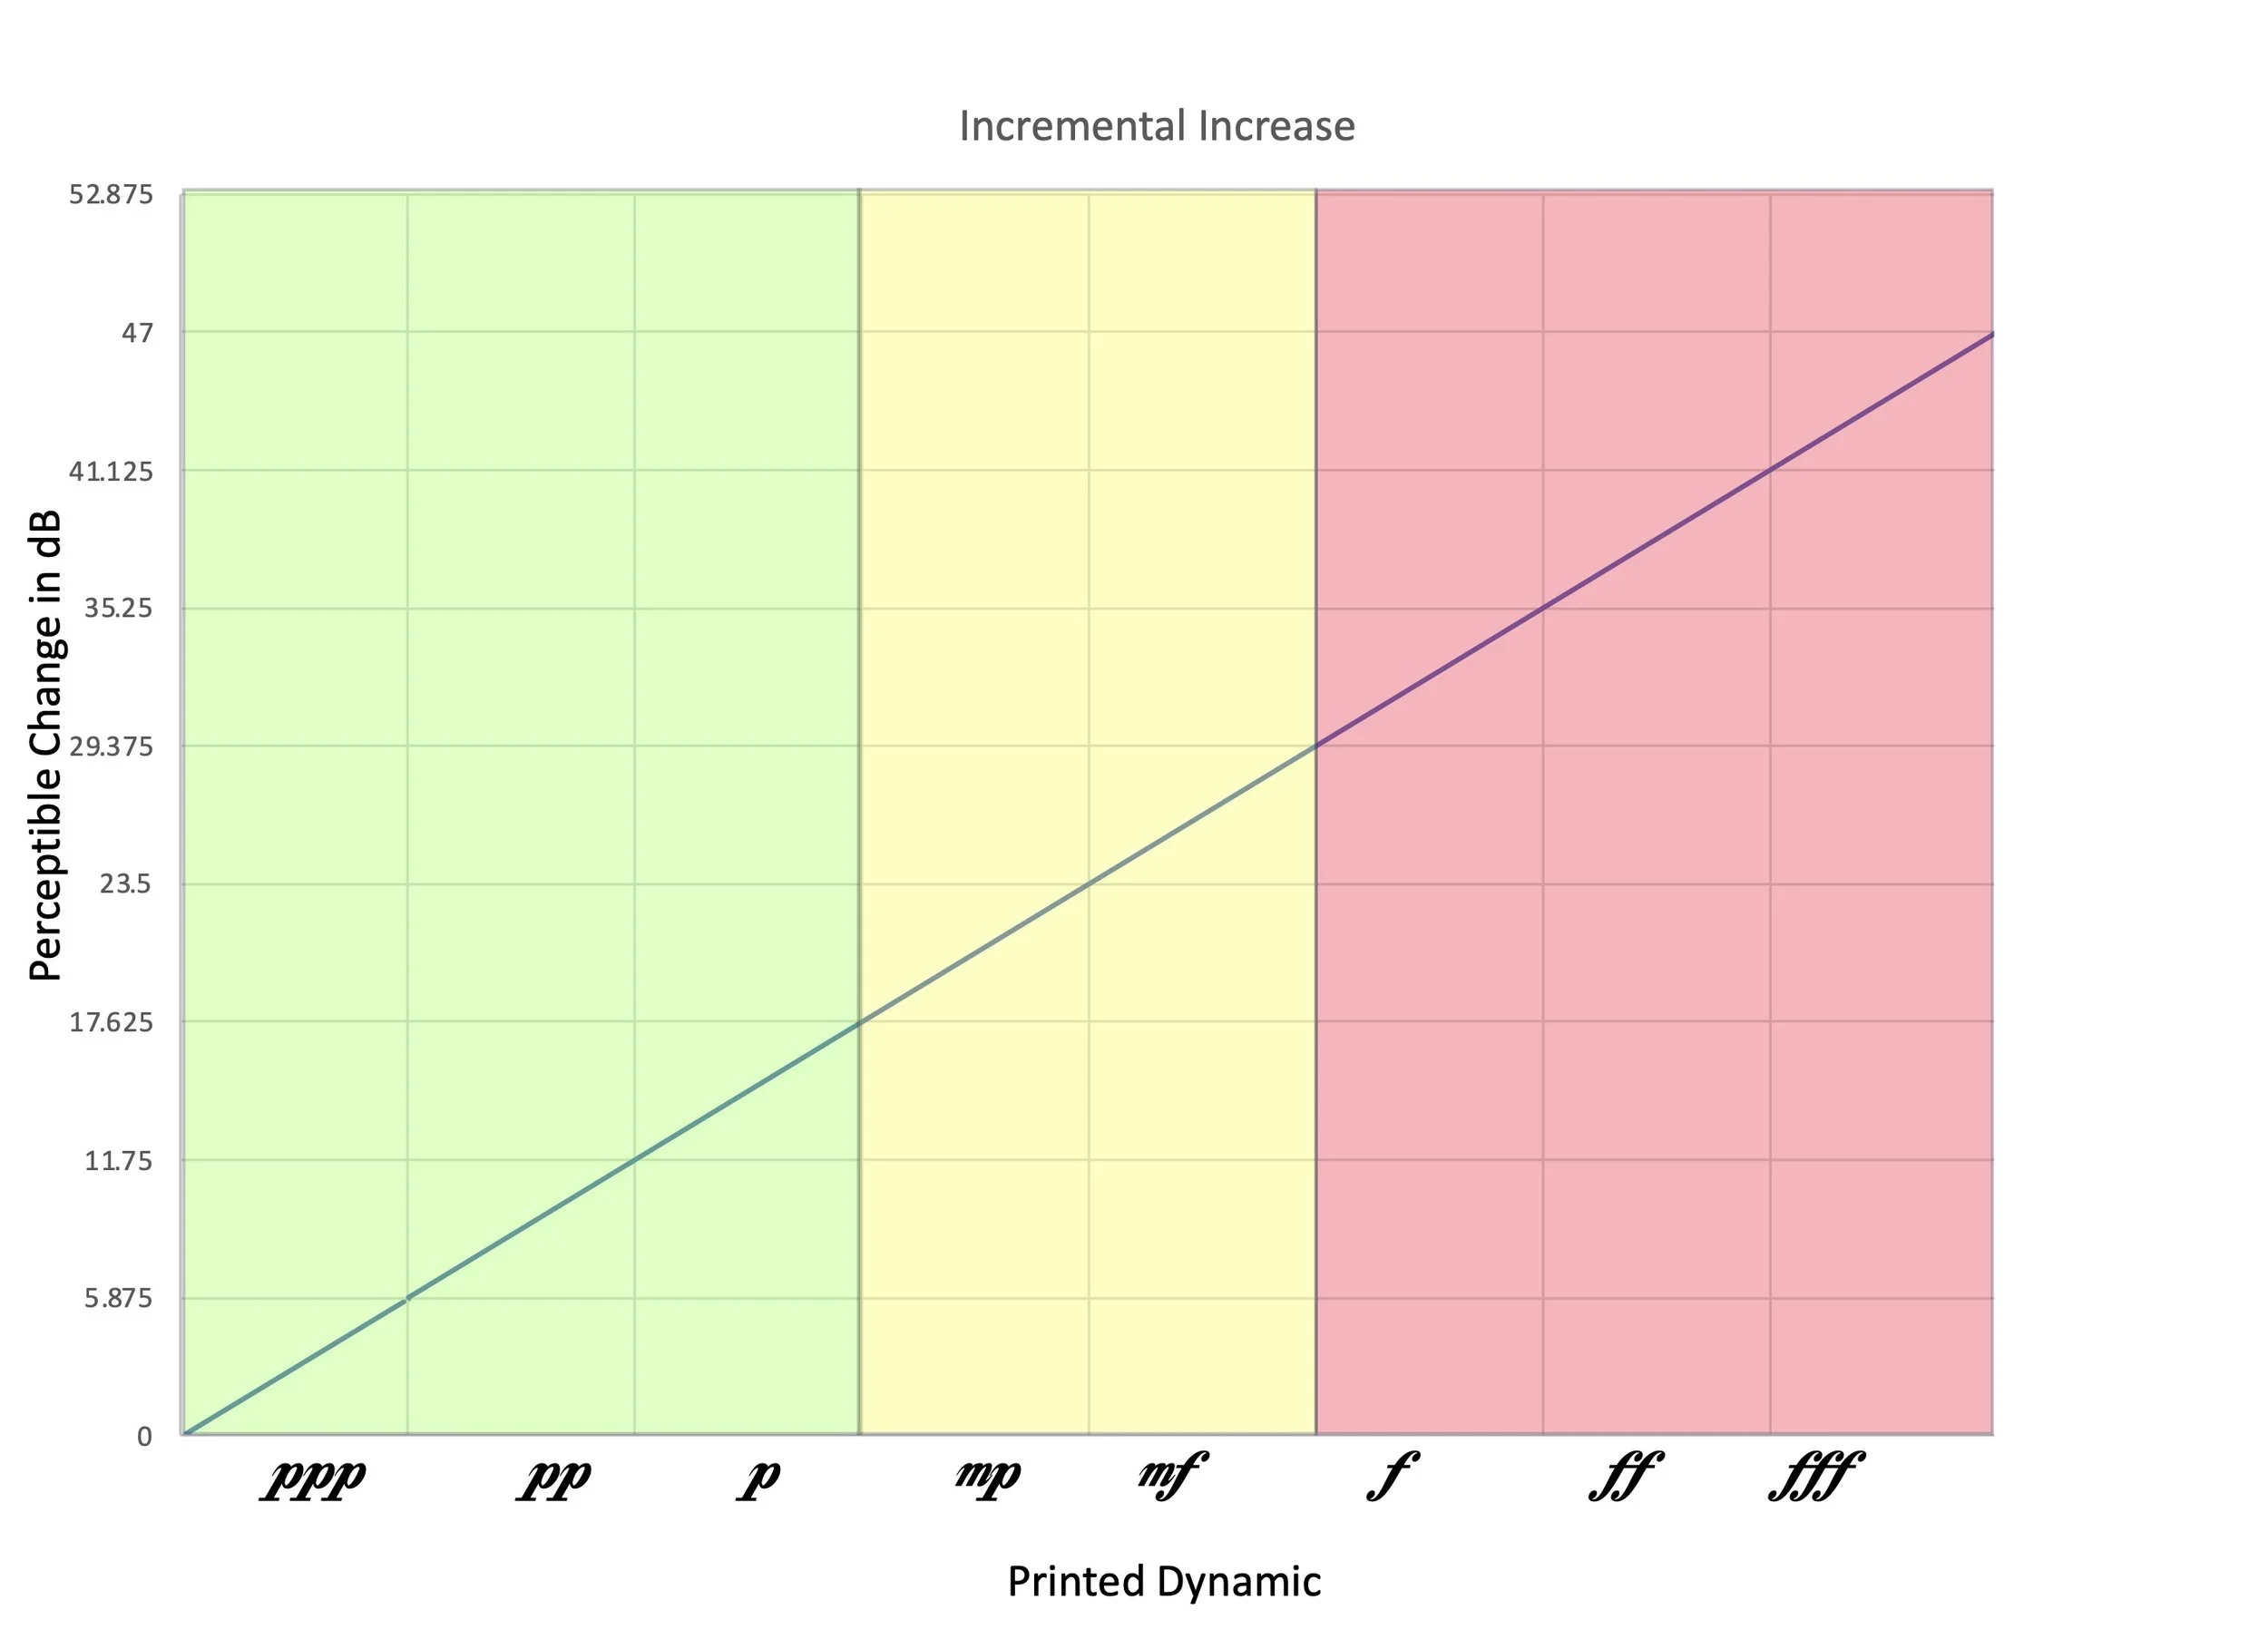
Dynamic change using a cubic curve.
There are other curves, including simple percentage curves, that achieve the same result, that is, lowering the level of the middle region (mp and mf ) of the range. I will continue to experiment with curves to define dynamic values when done with the clarinet sonata, but it’s time to get to work in earnest.
The next step is to rewrite the existing music using the new calculator to draw the energy down. I have already placed the required energy levels in the score using hit points. Hit points are used in film music to mark a particular point where the music has to coincide with an event in the film.
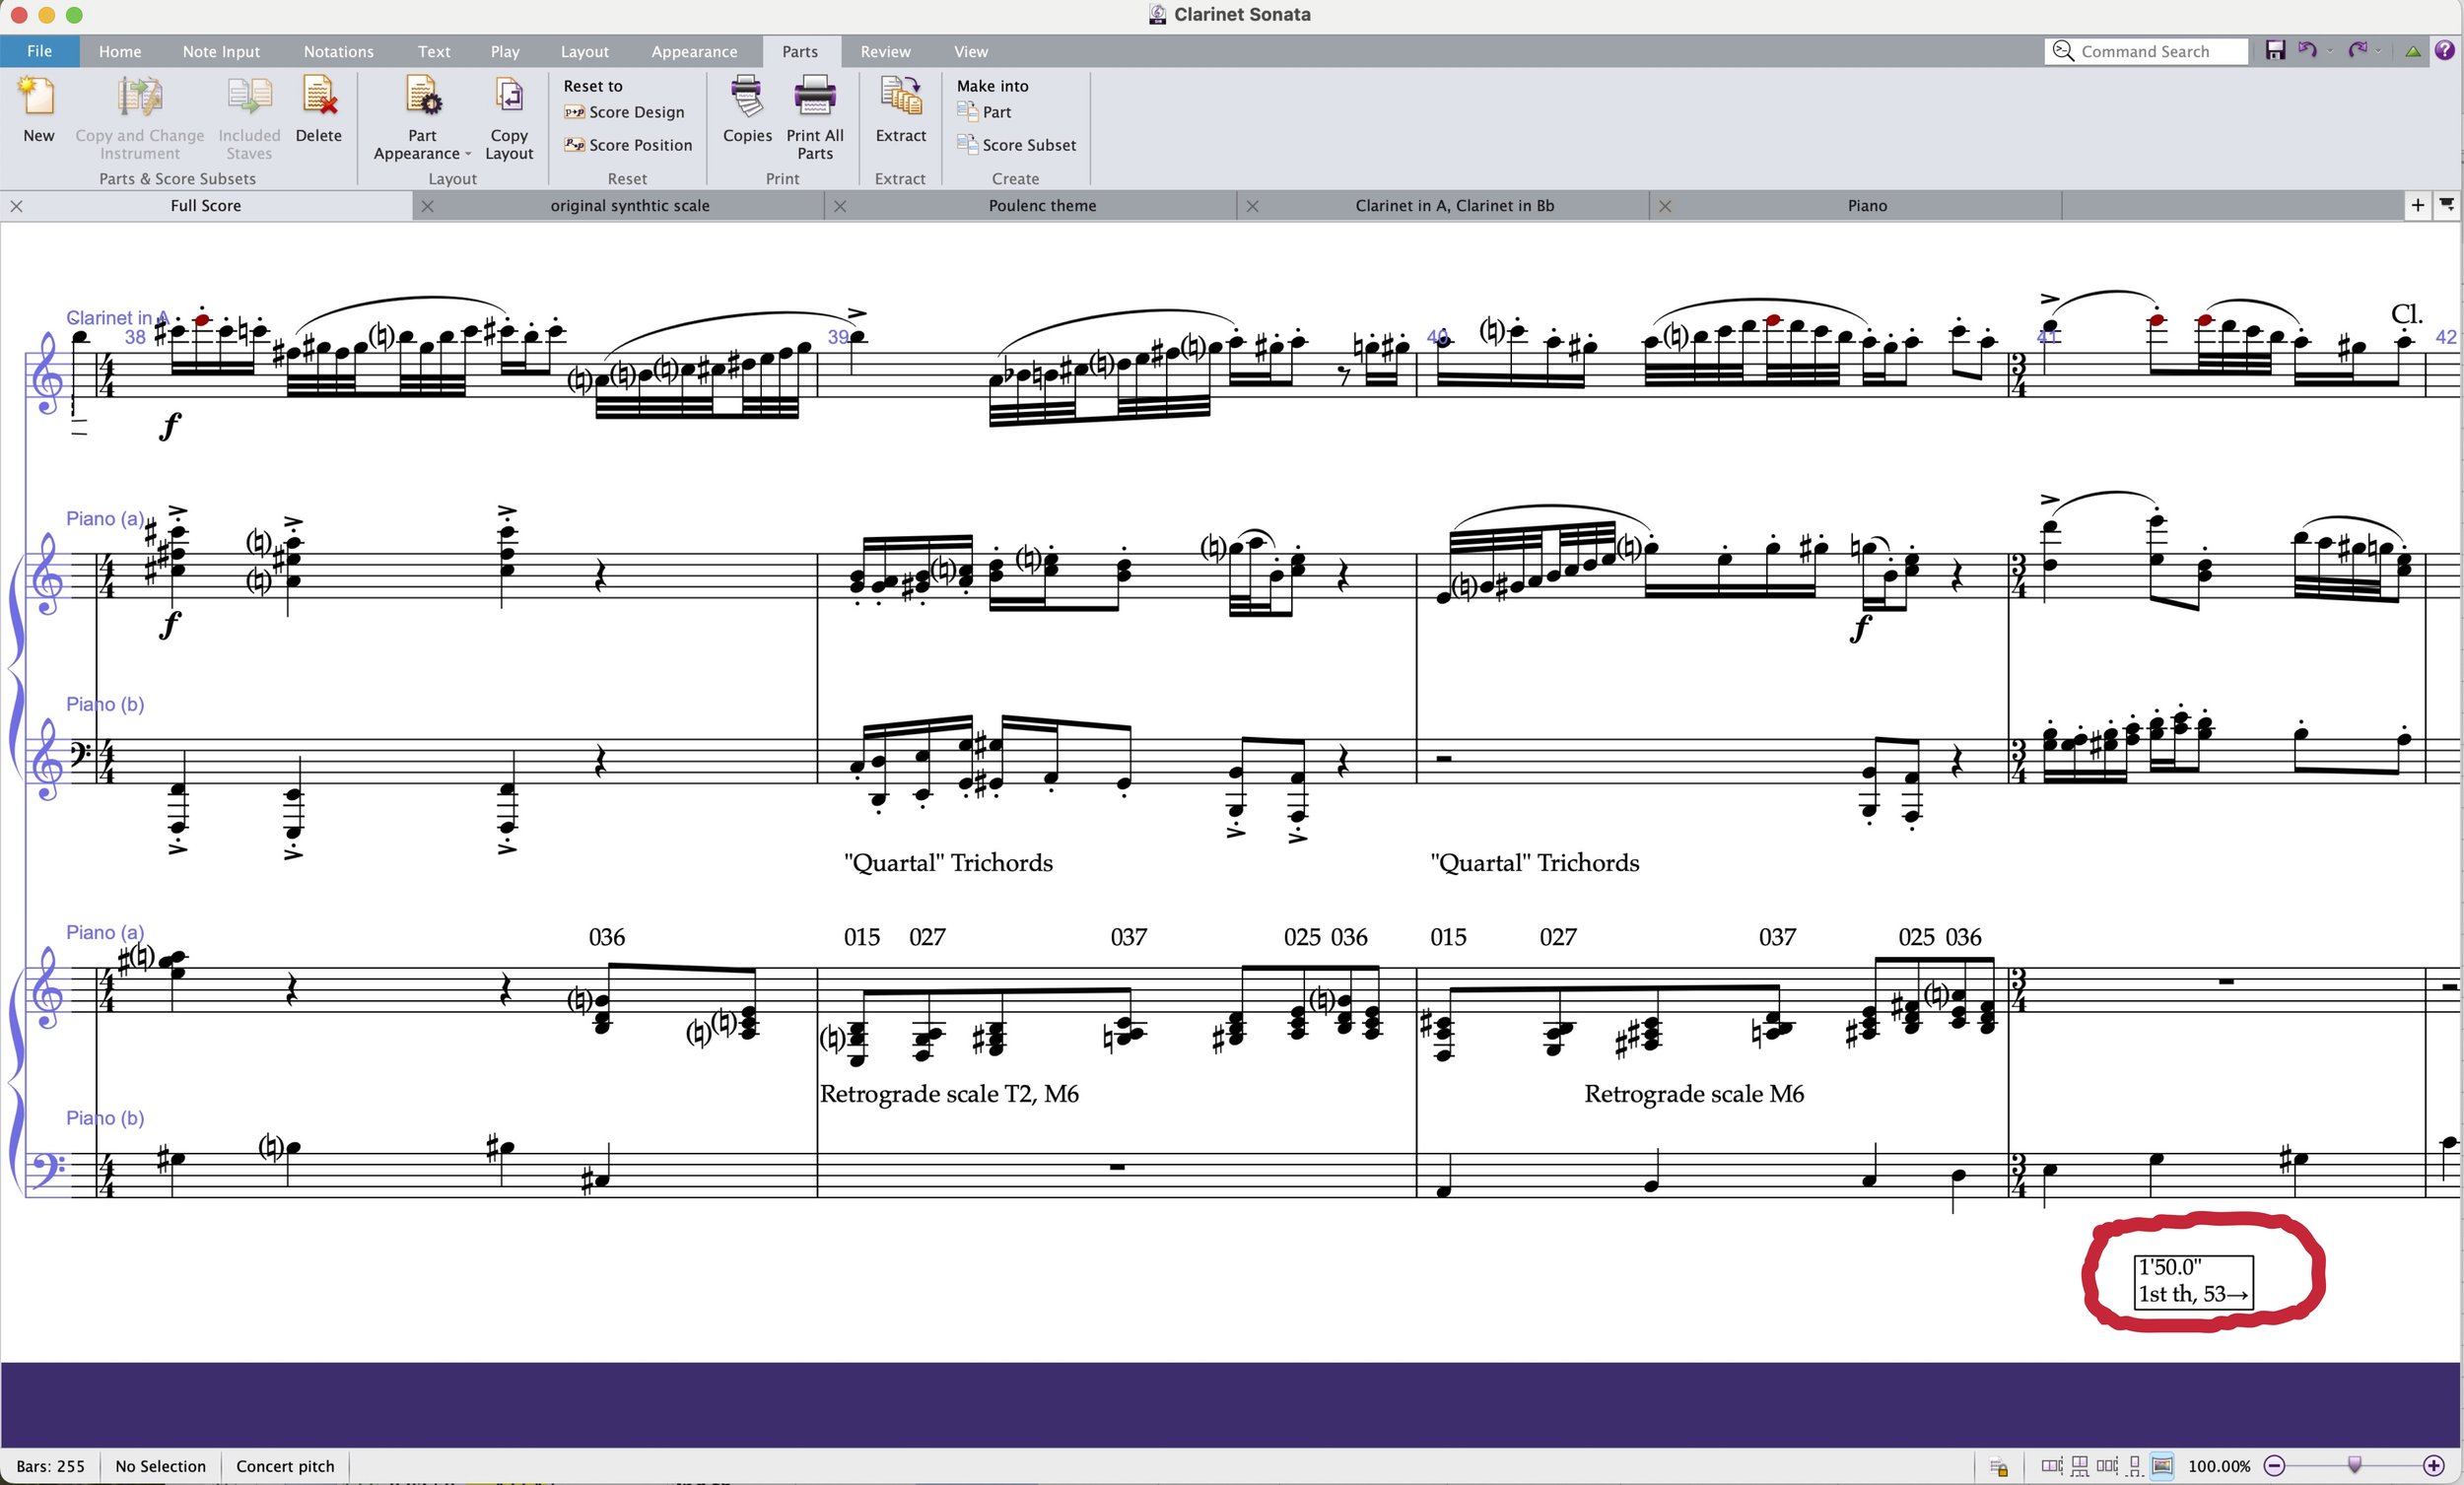
Excerpt of score showing embedded hit point.
I also have a second-by-second guide that gives me the energy level at any point during the piece.

Progressive energy levels.
The clarinet sonata will be my primary focus for the next few months and I’m looking forward to completing the first movement in the coming weeks. I will keep you posted on its progress.
As always thank you for your continued support and patience.
Brett